What is the Correlation Between Gold and Oil Prices? Has COVID-19 Changed this Forever?
02/09/2020Daniel Fisher
Free & fully insured UK Delivery. Learn more
Secure & flexible payments. Learn more

Buyback Guarantee Learn more
It is becoming increasingly apparent that the COVID-19 crisis has caused unprecedented disruption in the markets. Accepted constants in the market have been broken, as the price of gold has skyrocketed, while other commodities have moved in different directions. For more than 2 ½ decades, the gold oil ratio has been around 15:8. In layman’s terms, this means that 15.8 barrels of crude oil are worth the same as a troy ounce of gold.
Back in 2005, this ratio dropped to 6:2 due to massive rises in the price of oil. But, apart from these periodic aberrations, the gold-oil ratio has more or less remained constant. Oil price volatility has also driven this ratio up to 47:6 in 2016. So, what happened in 2016? The price of gold rose by 6% to jump to $ 1127 per ounce. Oil prices performed poorly in that year, along with the stock markets, but the ratio was disrupted as gold prices continue to rise.

The price of crude oil is intrinsically linked to gold prices
The common umbilical cord shared by both gold and oil is the US dollar. Since both gold and crude oil are priced in the market in US dollars, there is a correlation between the two commodities. Gold is considered by many to be more than a commodity – a precious metal that locks in value provides insurance against inflation and other market forces and hedges unwanted market risks. Oil, on the other hand, is representative of the energy we use in a fossil fuels based world. This simply means that all countries in the world have to acquire monetary resources to buy oil to run their economies.
Apart from being dollar-denominated assets, the price of crude oil is an important influencer in the stipulation of gold prices, gold mining company stocks and ETFs. Due to their valuation in the same global currency, a rise in the US dollar usually means the fall of other dollar-denominated assets. In this scenario, investors are wary of purchasing these assets as they become more expensive. So, ideally, when the US dollar falls, gold falls, as it becomes more affordable due to their strong linkage.

Gold has delinked itself from oil prices in 2020
Interestingly, there is another dimension to the problem. The rise of crude oil prices usually pushes up inflation. However, as we know, gold protects investors against inflation. The demand for gold, and subsequently its value also increases whenever there is a spike in inflation. So, now we can see the direct relationship between gold and oil prices. Gold does not behave like other dollar-denominated assets. The demand for these may plummet with the rise of oil prices, but gold, due to its inflationary protection attributes continues to remain attractive to investors when inflation is pushed up, due to oil prices.
Since all countries have to buy oil to fuel their economic growth, a rise in the price of oil slows down the economy. The domino effect that this has on industry dampens economic growth. Consequently, there is a fall in equity markets and investors move to gold. Once again, there is a direct correlation between the price of oil and that of gold. Recessionary phases like these can be lucrative for precious metal investors as they can book profits with the price of gold moving upwards. Surging oil prices can adversely impact the share price of mining companies, as well. Since oil is widely used in mining, rising oil prices squeeze the margins of these companies, resulting in a dip in their share prices.
At the beginning of 2019, the gold price ratio was 23:1, which was already high, but it rose further. Numerous factors affected the price of gold, resulting in significant increases. The world was already poised on the brink of a financial implosion that led to an avalanche.
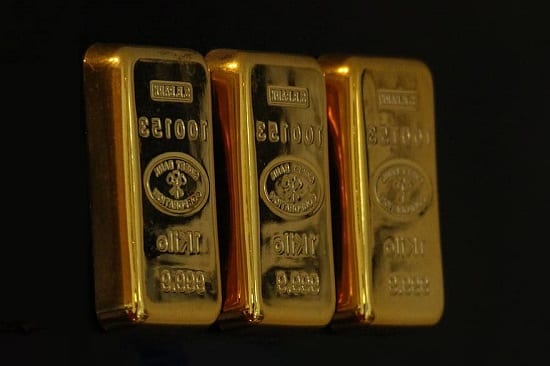
Investors starting to move their investments to gold bars (with sizes such as 1oz, 100g and 1 kilo) and gold coins (such as gold Britannias and gold Sovereigns). Other factors responsible for the rise of gold were:
All of these factors also led to the volatility of the global stock markets, resulting in more demand for gold. The COMEX gold futures price breached the $1400 per ounce mark in June 2019.

Crude oil remains the lifeblood of the global economy
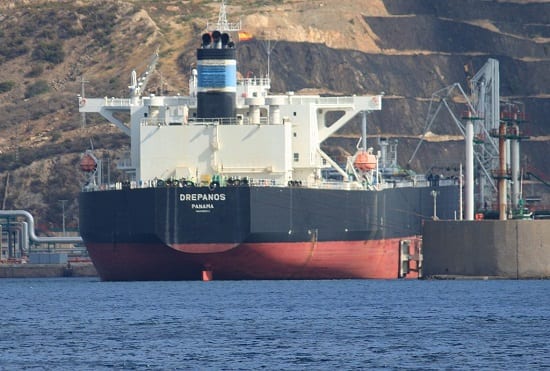
For all practical purposes, 2020 is not a normal year. The oil crisis started with Russia and Saudi Arabia at loggerheads with each other regarding the future of oil. Russia had refused to ramp up production to keep oil prices up. The price war was eventually triggered in March 2020, when OPEC failed to stabilise the market. Saudi Arabia started dumping crude oil into the market at heavily reduced prices.
This resulted in the WTI crude going down by 24.59% and reached a price of $31.13 per barrel. These prices have never been witnessed since the Middle Eastern war, which took place in 1991. The global investment bank, Goldman Sachs cut back on its outlook on Brent oil for the second and third quarter of the year, reducing it to $30 a barrel, with indications that eventually prices are likely to be as low as $20.
So, here was a new trend with oil prices falling and the price of gold reaching its highest point ever to $2067 on 6th August 2020. As we have seen above, the price of gold falls along with the price of oil. However, COVID-19 was different. While oil was dumped at cheaper rates, global economic fears prompted investors to buy gold in the hope of protecting their wealth.
The 2020 fall in oil prices was not entirely linked to coronavirus, but a reduction in industrial demand for oil due to manufacturing output reduction was. As were corresponding drops in fuel usage by the public as they travelled less and also the reduction in worldwide travel also created a reduction in demand for oil.
The rise of gold was certainly linked to the implosion of the global economy caused by COVID-19. It would be premature to say that the gold oil ratio has changed forever. 2020 has not been a normal year. It may take a couple of years during the post-pandemic era for things to stabilise, but once they do, the correlation between oil prices and gold may revert to pre-2020 levels.
Our gold researchers continuously study economic trends related to the international gold markets. Many people believe that the current price of gold isn’t viable for them to make a purchase. To get the right advice on selling and buying gold and silver, call Physical Gold Limited on (020) 7060 9992 or contact us online. We would love to speak to you and impart the right advice on buying gold.
Image Credits: Needpix, Pikist and Wikimedia Commons
Live Gold Spot Price in Sterling. Gold is one of the densest of all metals. It is a good conductor of heat and electricity. It is also soft and the most malleable and ductile of the elements; an ounce (31.1 grams; gold is weighed in troy ounces) can be beaten out to 187 square feet (about 17 square metres) in extremely thin sheets called gold leaf.
Live Silver Spot Price in Sterling. Silver (Ag), chemical element, a white lustrous metal valued for its decorative beauty and electrical conductivity. Silver is located in Group 11 (Ib) and Period 5 of the periodic table, between copper (Period 4) and gold (Period 6), and its physical and chemical properties are intermediate between those two metals.