Where in the World is the Gold? (Infographic)
04/06/2018Daniel Fisher
Free & fully insured UK Delivery. Learn more
Secure & flexible payments. Learn more

Buyback Guarantee Learn more
Here at Physical Gold, we have been looking at where the biggest gold mines are in the world which in turn led us to create or latest infographic ‘Where in the World is the Gold?’.
We looked at how much gold is produced in mines across the world and ranked the 10 largest producing mines worldwide. With anything, you like to know where your product was originally sourced, therefore we thought we would do the same for physical gold investors much a like yourself.

Where in the World is the Gold?
The craze for gold mining has been around for thousands of years. Archaeologists have found gold artefacts in Eastern Europe dating back to somewhere around 4700 BC. This would indicate that the practice of gold mining has been around for almost 7,000 years. Infact, gold was mined across the world. Gold mining sites have been found across Europe, North Africa, and even India. In India, gold was mined as early as the 2nd century AD and gold artefacts found in the ancient Harappa and Mohenjo-Daro civilizations, now part of modern-day Pakistan, have been traced back to the minefields in Kolar, in Southern India. The size of these operations grew during the reign of the Chola kings a few centuries later.
Roman miners used two different methods to mine gold. One was called hushing, which meant that a flood of water was released to expose the gold hidden below the silt and the soil. The other was called ground sluicing, which was essentially an open pit method. In the 19th century, there were a series of gold rushes all over the world, which led to the discovery of gold mining sites across the world.

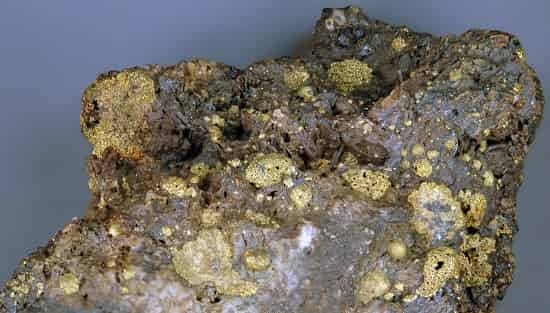
At the mining stage, the gold is buried inside the rock, fused with other materials
So far, the amount of gold that has been mined is approximately 171,300 tonnes. While that may seem large a large amount, it is important to know that gold is one of the rarest elements. In comparison to the entire volume of the Earth’s crust, the precious metal is only 0.003 parts per million of the entire crust. In fact, the scarcity of gold is one of the factors that makes it so precious.
It is widely believed that global gold production 
However, new explorations continue to take place, as several countries continue to fund searches for new gold. China, the world’s largest consumer of gold is one such country. China recently discovered new precious metals deposits, valued at nearly $60bn near the shared border with its neighbour, India. However, China’s mining operations in the region could create border tensions between the two countries. On the other hand, mining company Polyus, from Russia claims that their 2018 output is likely to be at the topmost range.
In this infographic, we have covered some of the significant gold mining projects across the world. China and Australia are the largest producers in the world, followed by the US, Russia, and Canada. Our team of experts can guide you on gold investing, how to generate good returns by investing in gold and when to buy and sell. For expert advice on gold investing, call 020 7060 9992 and speak to a member of our team, or drop us an email through the ‘contact’ section of our website.
Image credit: Wikimedia Commons
Live Gold Spot Price in Sterling. Gold is one of the densest of all metals. It is a good conductor of heat and electricity. It is also soft and the most malleable and ductile of the elements; an ounce (31.1 grams; gold is weighed in troy ounces) can be beaten out to 187 square feet (about 17 square metres) in extremely thin sheets called gold leaf.
Live Silver Spot Price in Sterling. Silver (Ag), chemical element, a white lustrous metal valued for its decorative beauty and electrical conductivity. Silver is located in Group 11 (Ib) and Period 5 of the periodic table, between copper (Period 4) and gold (Period 6), and its physical and chemical properties are intermediate between those two metals.